Getting Started
This introduction guides you through the first steps of using Axibase Time Series Database (ATSD).
Contents
- Introduction
- Inserting Data
- Portals
- Exporting Data
- SQL
- Alerting
Preparation
- Log in to your ATSD instance at
https://atsd_hostname:8443/.
Introduction
The operations underlying this tutorial insert and analyze temperature measurements collected from a hypothetical bioreactor such as the Parr Fixed Head Reactor pictured below.
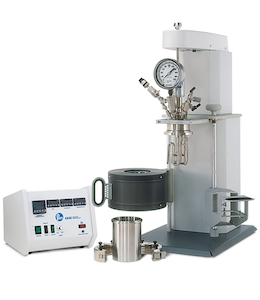
In a real-world situation, such measurements are continuously gathered by specialized controllers as part of the factory-wide SCADA system.
To differentiate this equipment from other factory assets, the tutorial refers to the reactor using the identifier in the asset management system:
br-1905
Writing Data
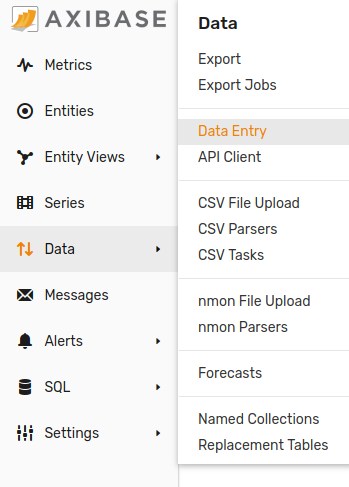
ATSD has numerous interfaces for data writing: API clients, CSV parsers, and REST API endpoints, but the simplest way to manually insert data is to submit samples as series command on Data > Data Entry.
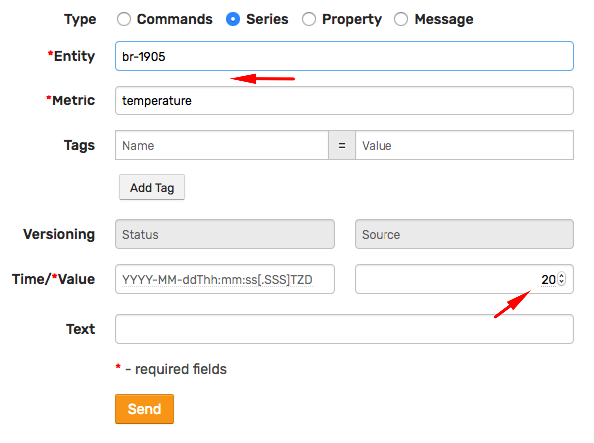
Select Series.

Enter br-1905 in the Entity field. As a universal database, ATSD uses entity as a generic term to refer to the monitored object. In this case, entity is synonymous with device.
Enter temperature in the Metric field.
The field Time/Value only requires that the right Value component be completed. Enter a hypothetical value. Optionally indicate time in ISO format. When left blank, the timestamp is set to the current time by ATSD.
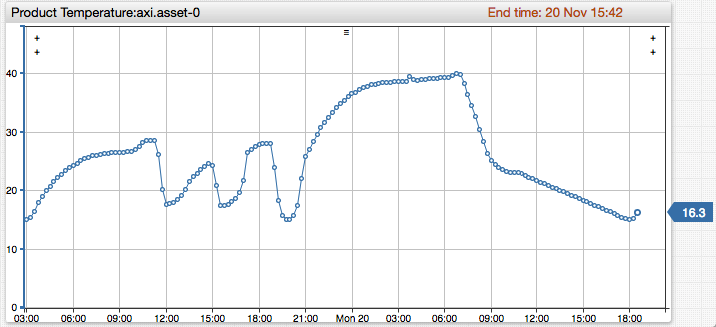
In a real manufacturing process, the temperature of the equipment itself is measured as outer or jacket temperature while the temperature of the compound inside the reactor is recorded as product temperature.
A sample product temperature chart is shown below:
Continue to enter numbers into the Value field and clicking Send, for example 20, 22, 30, 22. These records are now stored in the database as a series which contains multiple time:value observations.
Viewing Statistics
Click the Statistics icon to view summary information about the series.

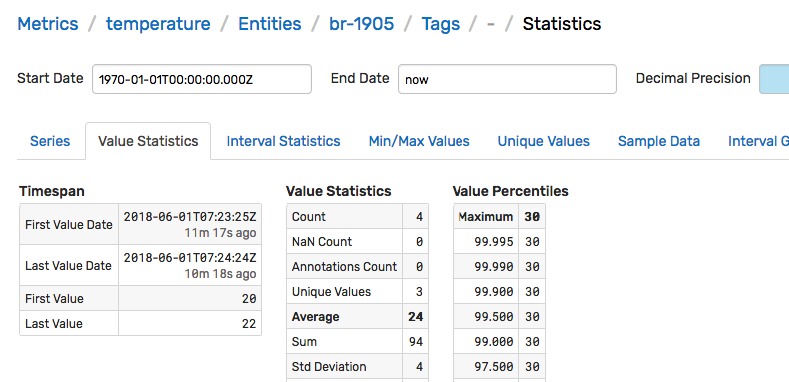
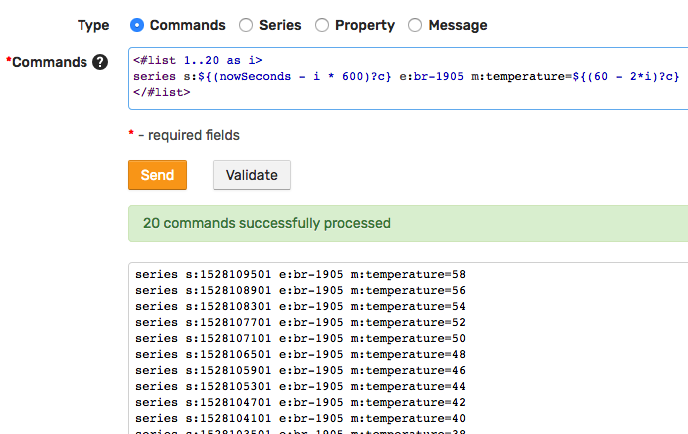
Inserting Initial Data
To populate the database with initial temperature readings, open the Commands tab and submit multiple series commands created using an iterator.
<#list 1..20 as i>
series s:${nowSeconds - i * 600} e:br-1905 m:temperature=${60 - 2*i}
</#list>
Visualizing Data
Click the Portal icon to view the default chart for the current temperature series.

Alternatively, enter https://atsd_hostname:8443/portals/series?entity=br-1905&metric=temperature in the address bar to view the portal.
The portal contains a time chart displaying average values for the last 24 hours.
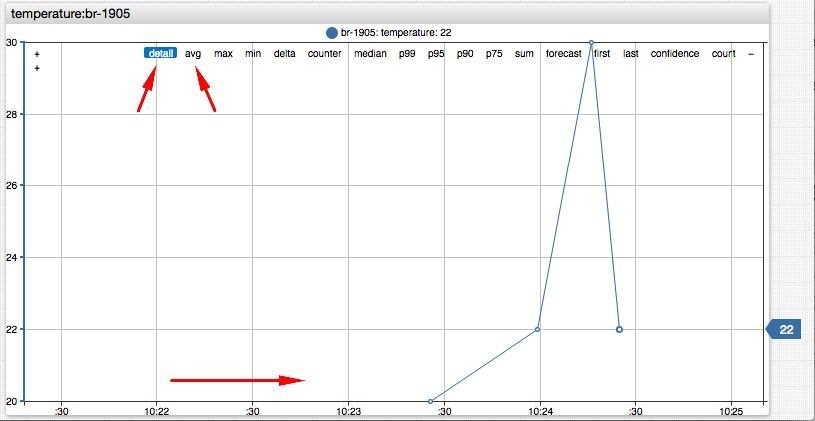
In the upper right corner select detail data type to view detailed values inserted by the previous step.
Click all in the timespan control to view all available data or use the mouse wheel to zoom and pan the time axis to a shorter time interval.
Take a moment to become familiar with Time Chart controls.
The default portal consists of a single time chart for one series. You can create portals with a custom layout and any number of widgets.
Adding Metadata
Describing Equipment
At this stage, you have collected temperature observations from the chemical reactor br-1905. The measurements are stored in the database as a series object comprising a sequence of time:value samples which can be analyzed and graphed.
| Date | Value |
|---|---|
| 2019-03-01T13:23:25Z | 20 |
| 2019-03-01T13:23:59Z | 22 |
| 2019-03-01T13:24:16Z | 30 |
| 2019-03-01T13:24:24Z | 22 |
To better organize the data, classify the br-1905 entity and clarify what kind of temperature the device collects.
Open the Entities page from the left menu in the ATSD web interface and search for br-1905. The search bar supports wildcards and partial matching.
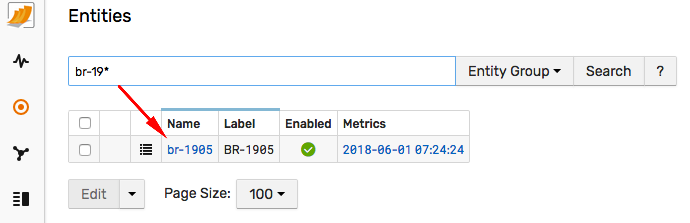
Open the entity editor to describe entities using custom tags that are specific for the given domain or industry.
Set Label to BR-1905, time zone to US/Pacific and set some custom tags:
type = bioreactor
model = 4520-1
manufacturer = Parr Instruments
reference_url = https://www.parrinst.com/products/stirred-reactors/series-4520-1-2l-bench-top-reactors/
site = SVL
building = A
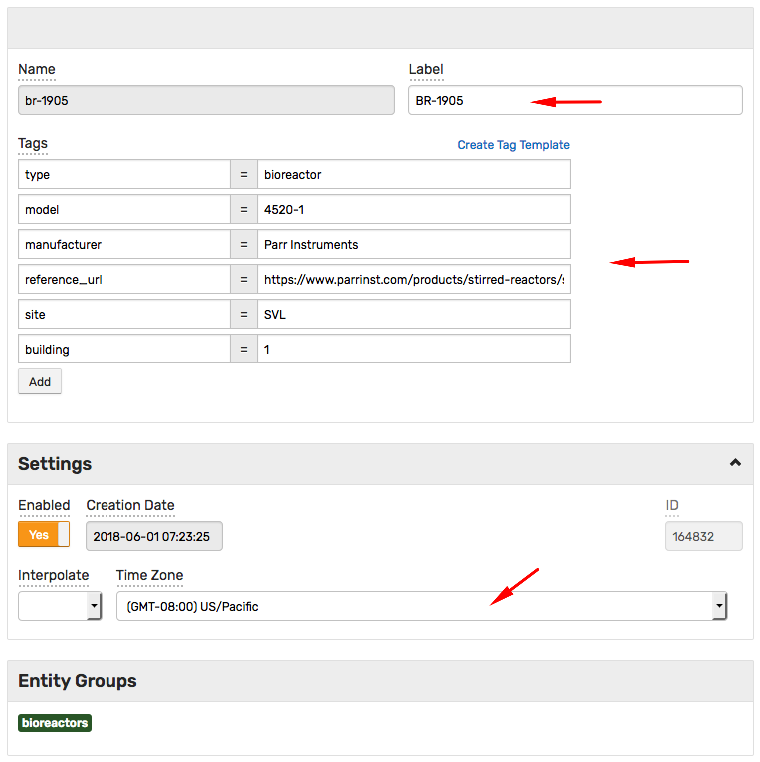
Entity tags provide an extensible mechanism to make a universal database specific to the current domain.
Define tags and click Create Tag Template to save the current tag schema as template which can be assigned to entities sharing the same tags.
Describing Metrics
Open Metrics from the left menu and search for temperature. The search bar supports wildcards and partial matching.
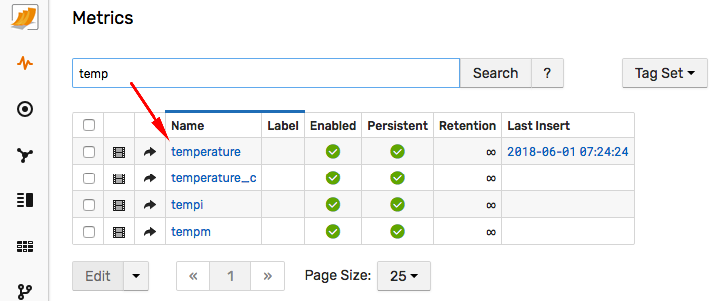
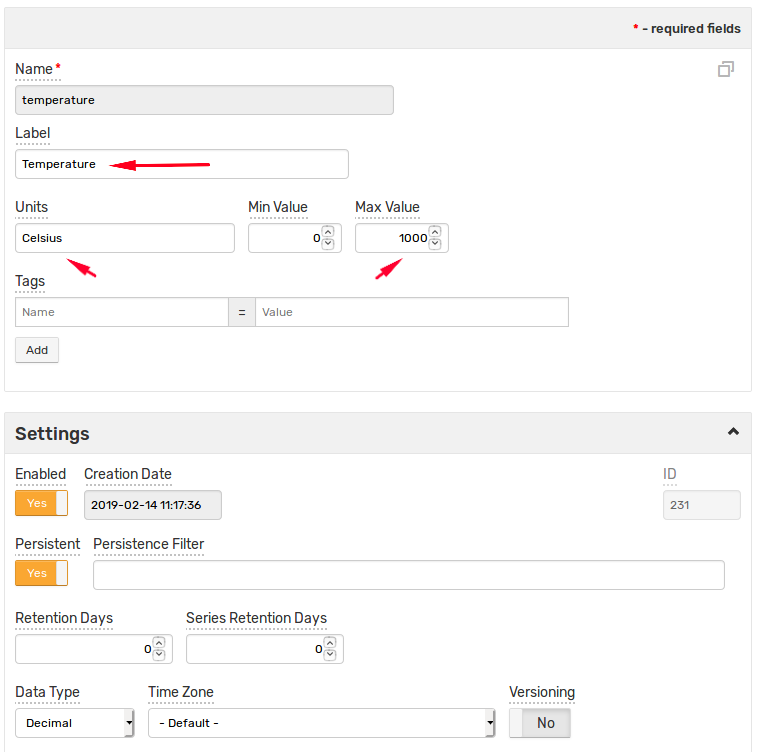
The Metric Editor provides additional fields such as units, precision, and seasonality to describe the measured attributes.
Set Label to Temperature and set the remaining fields:
units = Celsius
min_value = 0
max_value = 1000
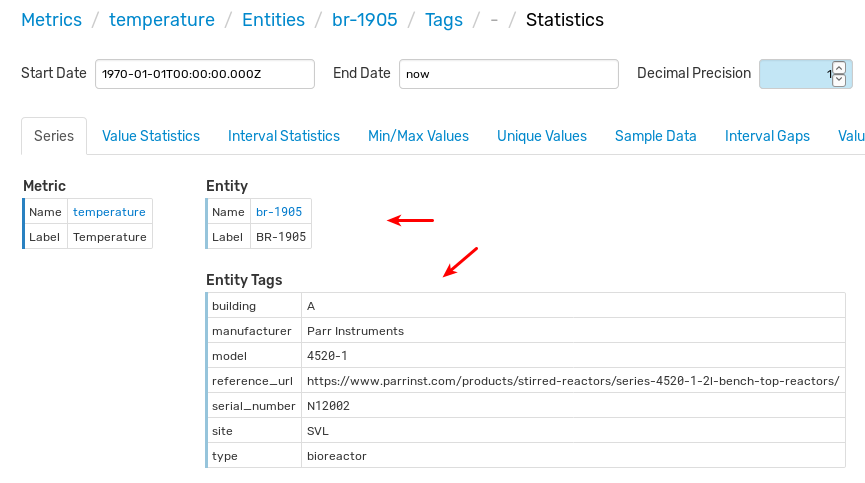
Refresh the Series Statistics page which now displays relevant metric and entity metadata.
https://atsd_hostname:8443/series/statistics?entity=br-1905&metric=temperature
Continue to Part 2: Insert Data.